
DB20-2-5X/100YU/12
Manufacturer: Bosch Rexroth
Material #: R978911970
Model : DB20-2-5X/100YU/12
$970.00 USD
Availability: Backordered
Ships from US
Qty:
Delivered as early as December 24, 2026
$1,018.50 USD
Availability: Backordered
Ships from CA
Qty:
Delivered as early as December 24, 2026
This product is eligible for factory repair.
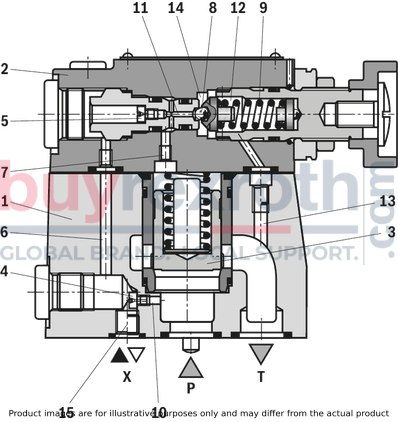
Pressure valve type DB is a pilot-operated pressure relief valve. It is used for limiting the operating pressure.
The pressure relief valves (DB) basically consist of the main valve (1) with main spool insert (3) and pilot control valve (2) with pressure adjustment element.
The pressure applied to channel P acts on the main spool (3). At the same time, pressure is applied to the spring-loaded side of the main spool (3) and to the ball (8) in the pilot control valve (2) via the control lines (6) and (7) which are equipped with nozzles (4) and (5). If the pressure in channel P exceeds the value set at the spring (9), the ball (8) opens against the spring (9). The corresponding signal comes internally, via the control lines (10) and (6) from channel P. The hydraulic fluid on the spring-loaded side of main spool (3) now flows via the control line (7), nozzle bore (11) and ball (8) into the spring chamber (12). From here, it is fed into the tank, either internally for type DB …– via control line (13), or externally for type DB…Y via control line (14). Nozzles (4) and (5) cause a pressure drop to occur at the main spool (3), hence the connection from channel P to channel T opens. Now, the hydraulic fluid flows from channel P to channel T maintaining the set operating pressure.
The pressure relief valve can be unloaded or switched to another pressure (second pressure rating) via port X (15).
|
01 |
02 |
03 |
04 |
05 |
06 |
07 |
08 |
09 |
10 |
11 |
12 |
13 |
14 |
15 |
16 |
17 |
18 |
19 |
20 |
21 |
22 |
|
|
DB |
5X |
/ |
* |
|
01 |
Pressure relief valve |
DB |
|
02 |
Without directional valve |
no code |
|
03 |
Pilot-operated valve (complete) |
no code |
|
Pilot control valve without main spool insert (do not enter any size) |
C |
|
|
Pilot control valve with main spool insert (enter size 10 or 30) |
C |
|
|
Pilot control valve without main spool insert for subplate mounting (do not enter any size) |
T 1) |
|
|
04 |
Size 10 |
|
|
Subplate mounting "no code" |
10 |
|
|
Threaded connection "G" |
10 (G1/2) |
|
|
Size 16 |
||
|
Threaded connection "G" |
15 (G3/4) |
|
|
Size 25 |
||
|
Subplate mounting "no code" |
20 |
|
|
Threaded connection "G" |
20 (G1) |
|
|
Threaded connection "G" |
25 (G1 1/4) |
|
|
Size 32 |
||
|
Subplate mounting "no code" |
30 |
|
|
Threaded connection "G" |
30 (G1 1/2) |
|
|
05 |
Without directional valve |
no code |
|
Type of connection |
||
|
06 |
Subplate mounting or cartridge valve |
no code |
|
For threaded connection |
G |
|
|
Adjustment type for pressure adjustment |
||
|
07 |
Rotary knob (not for version "C" and "T") |
1 |
|
Sleeve with hexagon and protective cap |
2 |
|
|
Lockable rotary knob with scale |
3 2) |
|
|
Rotary knob with scale |
7 |
|
|
08 |
Main spool Ø24 mm (all sizes) |
– |
|
Main spool Ø28 mm (only for NG32) |
N |
|
|
09 |
Component series 50 … 59 (50 … 59: unchanged installation and connection dimensions) |
5X |
|
10 |
Set pressure up to 50 bar |
50 |
|
Set pressure up to 100 bar |
100 |
|
|
Set pressure up to 200 bar |
200 |
|
|
Set pressure up to 315 bar |
315 |
|
|
Set pressure up to 350 bar |
350 |
|
|
Pilot oil flow |
||
|
11 |
External pilot oil supply, internal pilot oil return |
X 3) |
|
Internal pilot oil supply, external pilot oil return |
Y |
|
|
Pilot oil supply and pilot oil return external |
XY 3) |
|
|
12 |
Standard version |
no code |
|
Valve for minimum cracking pressure (not for versions "without main spool insert" and not suitable for mutual relief) |
U 4) |
|
|
13 |
Without switching shock damping |
no code |
|
14 |
Without directional valve |
no code |
|
15 |
Without directional valve |
no code |
|
16 |
Without manual override |
no code |
|
Electrical connection |
||
|
17 |
Without directional valve |
no code |
|
18 |
Without directional valve |
no code |
|
Corrosion resistance |
||
|
19 |
None |
no code |
|
Improved corrosion protection (240 h salt spray test according to EN ISO 9227) |
J3 5) |
|
|
Seal material |
||
|
20 |
NBR seals |
no code |
|
FKM seals |
V |
|
|
Observe compatibility of seals with hydraulic fluid used. (Other seals upon request) |
||
|
Equipment Directive |
||
|
21 |
Without type-examination procedure |
no code |
|
Type-examination tested safety valve according to Pressure Equipment Directive 2014/68/EU |
E |
|
|
22 |
Further details in the plain text |
* |
| 1) | DBT corresponds to DBC, however with closed central bore |
| 2) | H-Key with material no. R900008158 is included in the scope of delivery. |
| 3) | Not with version "DBC" |
| 4) | Only possible up to pressure rating 315 bar |
| 5) | Only version "2", however without protective cap |
Type-examination tested safety valves type DB…E
(Component series 5X according to Pressure Equipment Directive 2014/68/EU)
|
NG |
Type designation |
Component marking |
Maximum flow qVmax in l/min with pilot oil return |
Set response overpressurep in bar |
|
|
external "Y" |
internal "–" |
||||
|
10 |

|
TÜV.SV.▢ – 851.12.F.G.p |
170 230 230 230 |
130 200 200 200 |
30 ... 60 61 ... 110 111 ... 210 211 ... 350 |
|
25 |

|
TÜV.SV.▢ – 852.22.F.G.p |
250 270 420 450 |
180 210 320 400 |
30 ... 60 61 ... 110 111 ... 210 211 ... 350 |
|
32 |

|
TÜV.SV.▢ – 853.32.F.G.p |
600 600 650 700 |
225 340 540 580 |
30 ... 60 61 ... 110 111 ... 210 211 ... 350 |
|
1 |
For subplate mounting |
no code |
|
For threaded connection |
G |
|
|
Adjustment type for pressure adjustment |
||
|
2 |
Hand wheel (pressure adjustment sealed, unloading or setting of a lower response pressure possible!) |
1 |
|
With sealed protective cap (no adjustment/unloading possible) |
2 |
|
|
Pressure |
||
|
3 |
To be entered by the customer, e.g. pressure adjustment ≥ 30 bar and possible in 5 bar steps. |
e.g. 150 |
|
Pilot oil flow |
||
|
4 |
Pilot oil supply internal, pilot oil return internal |
no code |
|
Pilot oil supply internal, pilot oil return external (Recommendation) |
Y 1) |
|
|
5 |
NBR seals |
no code |
|
FKM seals |
V |
|
|
▢ |
Value entered at the factory |
|
| 1) | Pilot oil supply external "X" not possible |
(measured with HLP46, ϑOil = 40 ±5 °C)
Standard version
Minimum set pressure and circulation pressure dependent on the flow 1)

| 1) | The characteristic curves apply to an output pressure pT =0 bar in the entire flow range. |
Version “U”
Minimum set pressure and circulation pressure dependent on the flow 1)

Inlet pressure dependent on the flow

Notice:
The characteristic curves were measured with external, depressurized pilot oil return.
Due to the internal pilot oil return, the inlet pressure increases by the output pressure present in port T.
Pilot flow

Type-examination tested safety valves
(Component series 5X, according to Pressure Equipment Directive 2014/68/EU)
Counter pressure in the discharge line
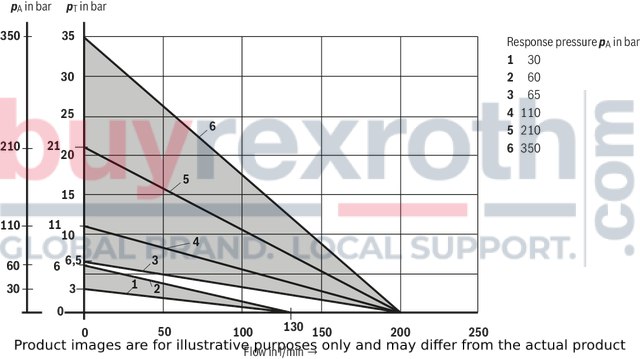
Basically, the valve should be operated without counter pressure in the discharge line, if possible. With counter pressure in the discharge line, the maximum flow possible is reduced. There is a relation between the maximum counter pressure pT in the discharge line and flow qV, which can be seen from the following characteristic curves. Characteristic curves for intermediate values of the response pressure which are not listed must be determined by means of interpolation.
With a flow approaching zero, the maximum counter pressure pT is in each case 10 % of the response pressure. With increasing flow, the maximum counter pressure pT is reduced.
Interpolation of intermediate values from the diagram
At the pT axis, mark 1/10 of the value of pA. Determine the next lower and the next higher characteristic curve for this point. The point marked at pT divides the section between lower and higher characteristic curve on the pT axis with a certain percentage. At the qVmax axis, divide the section between next lower and next higher characteristic curve in the same percentage as the section at the pT axis. From the zerocrossing on the qVmax axis determined in that way, draw a straight line to the value on the pT axis marked before. Mark the system flow to be secured at the qVmax axis. Read off the maximum counter pressure for this value using the line at the pT axis drawn before.
Determination of the maximum counter pressure
Example 1 (with already existing characteristic curve):
Flow of the system / accumulator to be secured:qVmax = [si]300 l/min[/si][imp]79.3 USgpm[/imp Safety valve set to: pA = [si]80 bar[/si][imp]1150 psi[/imp]. Read off the maximum counter pressure pT of approx. [si]12 bar[/si][imp]175 psi[/imp] from the diagram (see arrows, dashed line " ").
Example 2 (with interpolated characteristic curve):
Flow of the system / accumulator to be secured: qVmax = [si]300 l/min[/si][imp]79.3 USgpm[/imp Safety valve set to: pA = [si]80 bar[/si][imp]1150 psi[/imp] Value to be marked at the axis referred to as pT: 1/10 x [si]80 bar[/si][imp]1150 psi[/imp] = [si]8 bar[/si][imp]115 psi[/imp]. Read off the maximum counter pressure pT of approx. [si]1 bar[/si][imp]15 psi[/imp] from the diagram (see arrows, dashed/dotted line " ").
Size 10
Diagram for determining the maximum counter pressure pT in the discharge line at port T of the valve dependent on the flow qVmax for valves type DB(W)...E with different response pressures pA.Intermediate values may be determined by means of interpolation. Regarding the procedure for interpolation refer to "Interpolation of intermediate values from the diagram".
Size 20
Diagram for determining the maximum counter pressure pT in the discharge line at port T of the valve dependent on the flow qVmax for valves type DB(W)...E with different response pressures pA.Intermediate values may be determined by means of interpolation. Regarding the procedure for interpolation refer to "Interpolation of intermediate values from the diagram".

Size 30
Diagram for determining the maximum counter pressure pT in the discharge line at port T of the valve dependent on the flow qVmax for valves type DB(W)...E with different response pressures pA.Intermediate values may be determined by means of interpolation. Regarding the procedure for interpolation refer to "Interpolation of intermediate values from the diagram".

|
pA |
Response pressure in bar |
|
pT |
Maximum counter pressure in the discharge line (port T) in bar (sum of all possible counter pressures; also see AD2000 data sheet - A2) |
|
pT max |
10% x pA (with qV=0 l/min) according to Pressure Equipment Directive 2014/68/EU |
|
qV max |
Maximum flow in l/min |
Type DB…–…
|
Type DB…X…
|
Type DB…Y…
|
Type DB…XY…
|
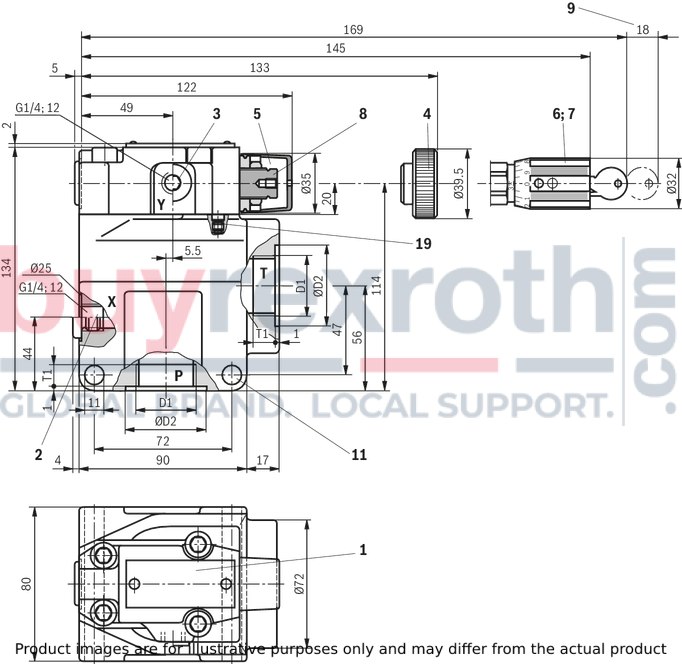
Threaded connection "G"
Dimensions in mm
|
1 |
Name plate |
|
2 |
X port for pilot oil supply, external |
|
3 |
Y port for pilot oil return, external |
|
4 |
Adjustment type "1" |
|
5 |
Adjustment type "2" |
|
6 |
Adjustment type "3" |
|
7 |
Adjustment type "7" |
|
8 |
Hexagon SW10 |
|
9 |
Space required to remove the key |
|
11 |
Valve mounting bores |
|
19 |
Omitted with internal pilot oil return |
|
Version |
D1 |
ØD2 |
T1 |
|
mm |
mm |
||
| "DB 10 G" | G1/2 | 34 | 14 |
| "DB 15 G" | G3/4 | 42 | 16 |
| "DB 20 G" | G1 | 47 | 18 |
| "DB 25 G" | G1 1/4 | 58 | 20 |
| "DB 30 G" | G1 1/2 | 65 | 22 |
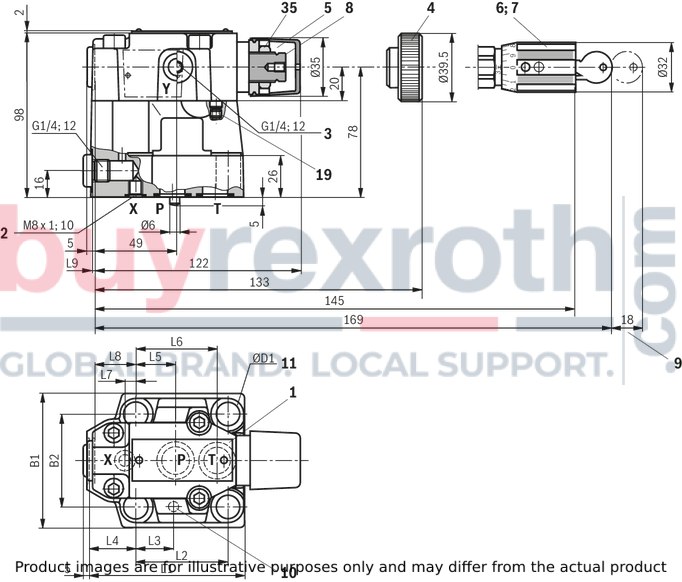
Subplate mounting "no code"
Dimensions in mm
|
1 |
Name plate |
|
2 |
X port for pilot oil supply, external |
|
3 |
Y port for pilot oil return, external |
|
4 |
Adjustment type "1" |
|
5 |
Adjustment type "2" |
|
6 |
Adjustment type "3" |
|
7 |
Adjustment type "7" |
|
8 |
Hexagon SW10 |
|
9 |
Space required to remove the key |
|
10 |
Locking pin |
|
11 |
Valve mounting bores |
|
19 |
Omitted with internal pilot oil return |
|
35 |
Lock nut SW17, tightening torque MA = 10+5 Nm |
|
Version |
L1 |
L2 |
L3 |
L4 |
L5 |
L6 |
L7 |
L8 |
L9 |
B1 |
B2 |
ØD1 |
|
mm |
mm |
mm |
mm |
mm |
mm |
mm |
mm |
mm |
mm |
mm |
mm |
|
| "DB 10" | 91 | 53.8 | 22.1 | 27.5 | 22.1 | 47.5 | 0 | 25.5 | 2 | 78 | 53.8 | 14 |
| "DB 20" | 116 | 66.7 | 33.4 | 33.3 | 11.1 | 55.6 | 23.8 | 22.8 | 10.5 | 100 | 70 | 18 |
| "DB 30" | 147.5 | 88.9 | 44.5 | 41 | 12.7 | 76.2 | 31.8 | 20 | 21 | 115 | 82.6 | 20 |
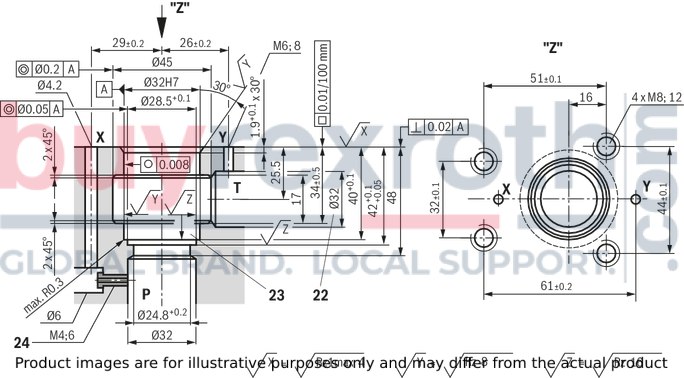
Pilot control valve with ("DBC 10 or 30") or without main spool insert ("DBC, DBT")
Dimensions in mm

Installation bore
Dimensions in mm
|
1 |
Name plate |
|
3 |
Y port for pilot oil return, external |
|
5 |
Adjustment type "2" |
|
6 |
Adjustment type "3" |
|
7 |
Adjustment type "7" |
|
8 |
Hexagon SW10 |
|
9 |
Space required to remove the key |
|
11 |
Valve mounting bores |
|
20 |
Seal ring |
|
21 |
Main spool insert |
|
22 |
Bore Ø32 mm can cut Ø45 mm at any point. However, it must be observed that the connection bore X and the mounting bore are not damaged! |
|
23 |
Support ring and seal ring are to be inserted into this bore before assembly of the main spool. |
|
24 |
Nozzle (separate order; recommended nozzle Ø1.0 mm) |
|
25 |
Seal ring |
|
26 |
Seal ring |
|
27 |
Seal ring |
|
28 |
Support ring |
|
29 |
Support ring |
|
35 |
Lock nut SW17, tightening torque MA = 10+5 Nm |
Valve mounting screws (separate order)
For reasons of stability, exclusively the following valve mounting screws may be used:
Version "DB 10"4 x ISO 4762 - M12 x 50 - 10.9-flZn/nc/480h/C
with friction coefficient μtotal = 0.09 … 0.14
tightening torque MA = 75 Nm ±10%
material no. R913015611 Version "DB 20"
4 x ISO 4762 - M16 x 50 - 10.9-flZn/nc/480h/C
with friction coefficient μtotal = 0.09 … 0.14
tightening torque MA = 185 Nm ±10%
material no. R913015664 Version "DB 30"
4 x DIN 912 - M18 x 50 - 10.9-flZn/nc/480h/C
with friction coefficient μtotal = 0.09 … 0.14
tightening torque MA = 248 Nm ±10%
material no. R913015903 Version "DBC", "DBC 10", "DBC 30" and "DBT"
4 x ISO 4762 - M8 x 40 - 10.9-flZn/nc/480h/C
with friction coefficient μtotal = 0.09 … 0.14
tightening torque MA = 31 Nm ±10%
material no. R913015798
Notice:
The tightening torques stated are guidelines when using screws with the specified friction coefficients and when using a manual torque wrench (tolerance ±10%).

|
|
Required surface quality of the valve contact surface |
Related Products
R900942087
$1,310.00 USD
R978915891
$1,193.00 USD
R901187508
$1,376.00 USD
R901330837
$1,043.00 USD
R900353721
$745.00 USD